Monitor data pipelines
Spot data pipeline errors from light years away
Get a bird's-eye overview of your data pipelines' health or zoom in for granular analysis. Y42's asset monitor is a telescope and microscope rolled into one.
Health monitoring
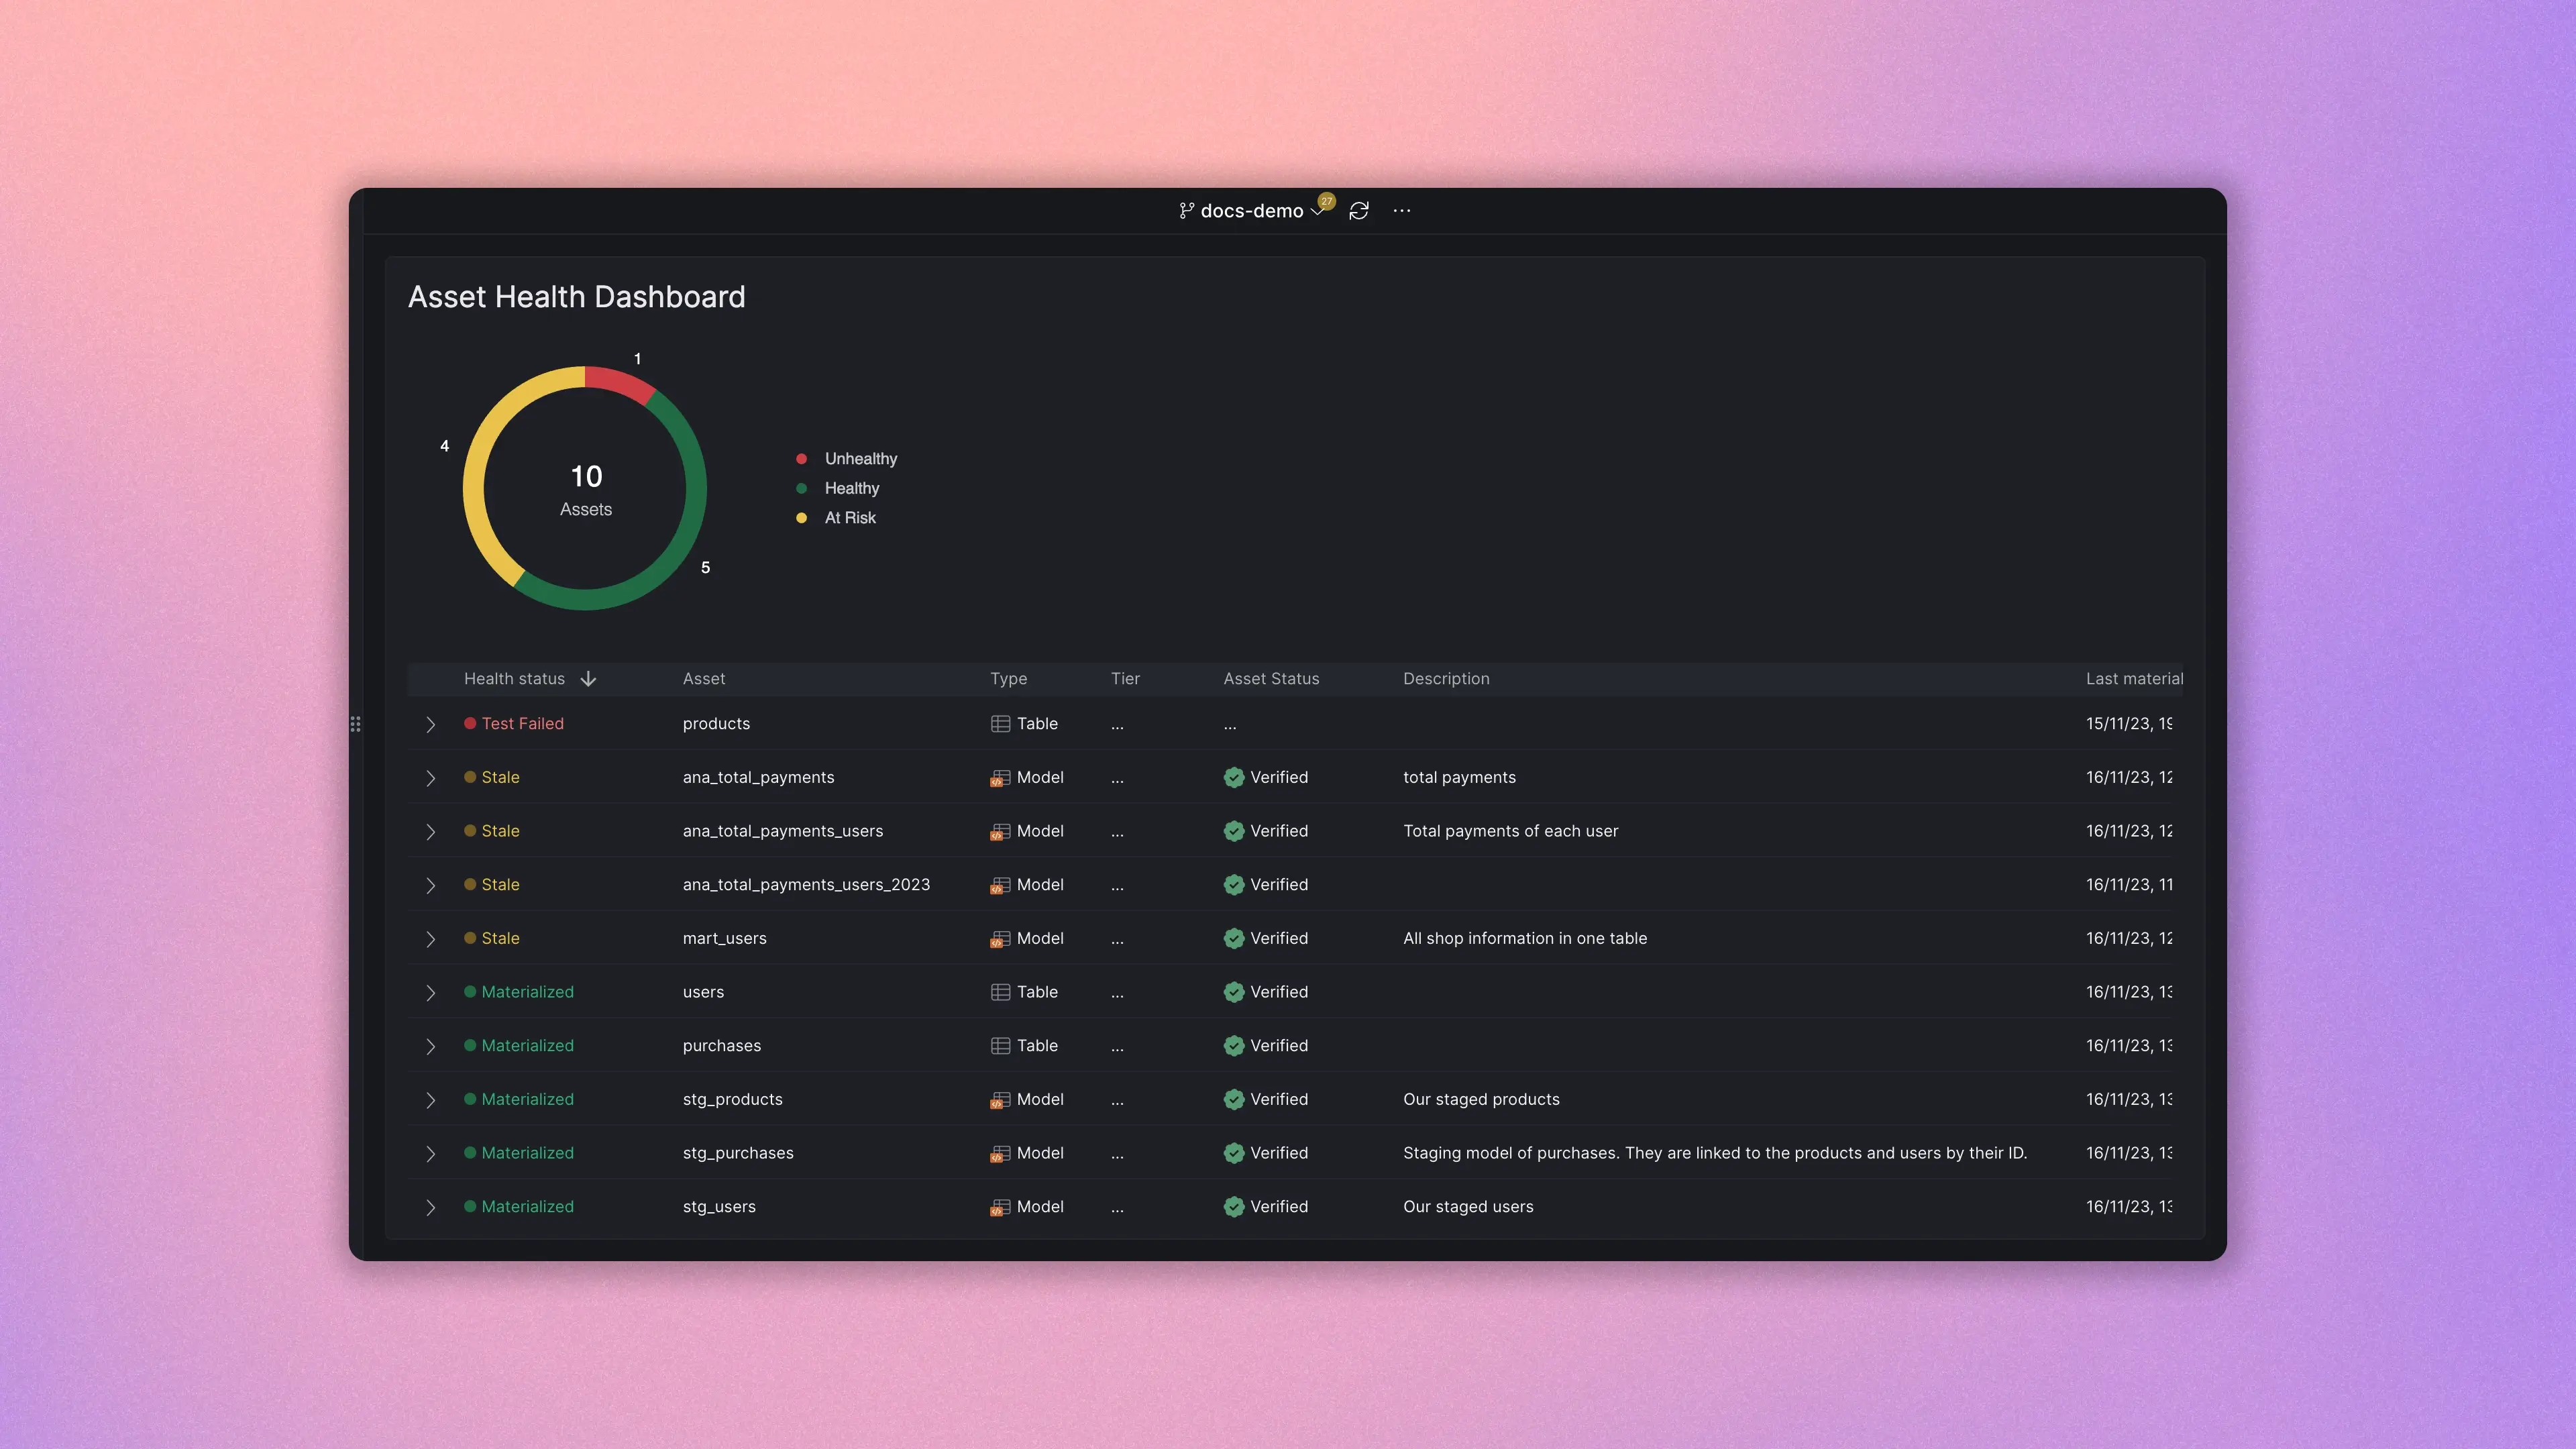
Your Mission Control Center for data pipeline health
Y42's asset health monitor lets you verify the build status and freshness of every step in your data pipelines in a single dashboard... and you'll never have to sift through multiple job logs again.
Explore documentation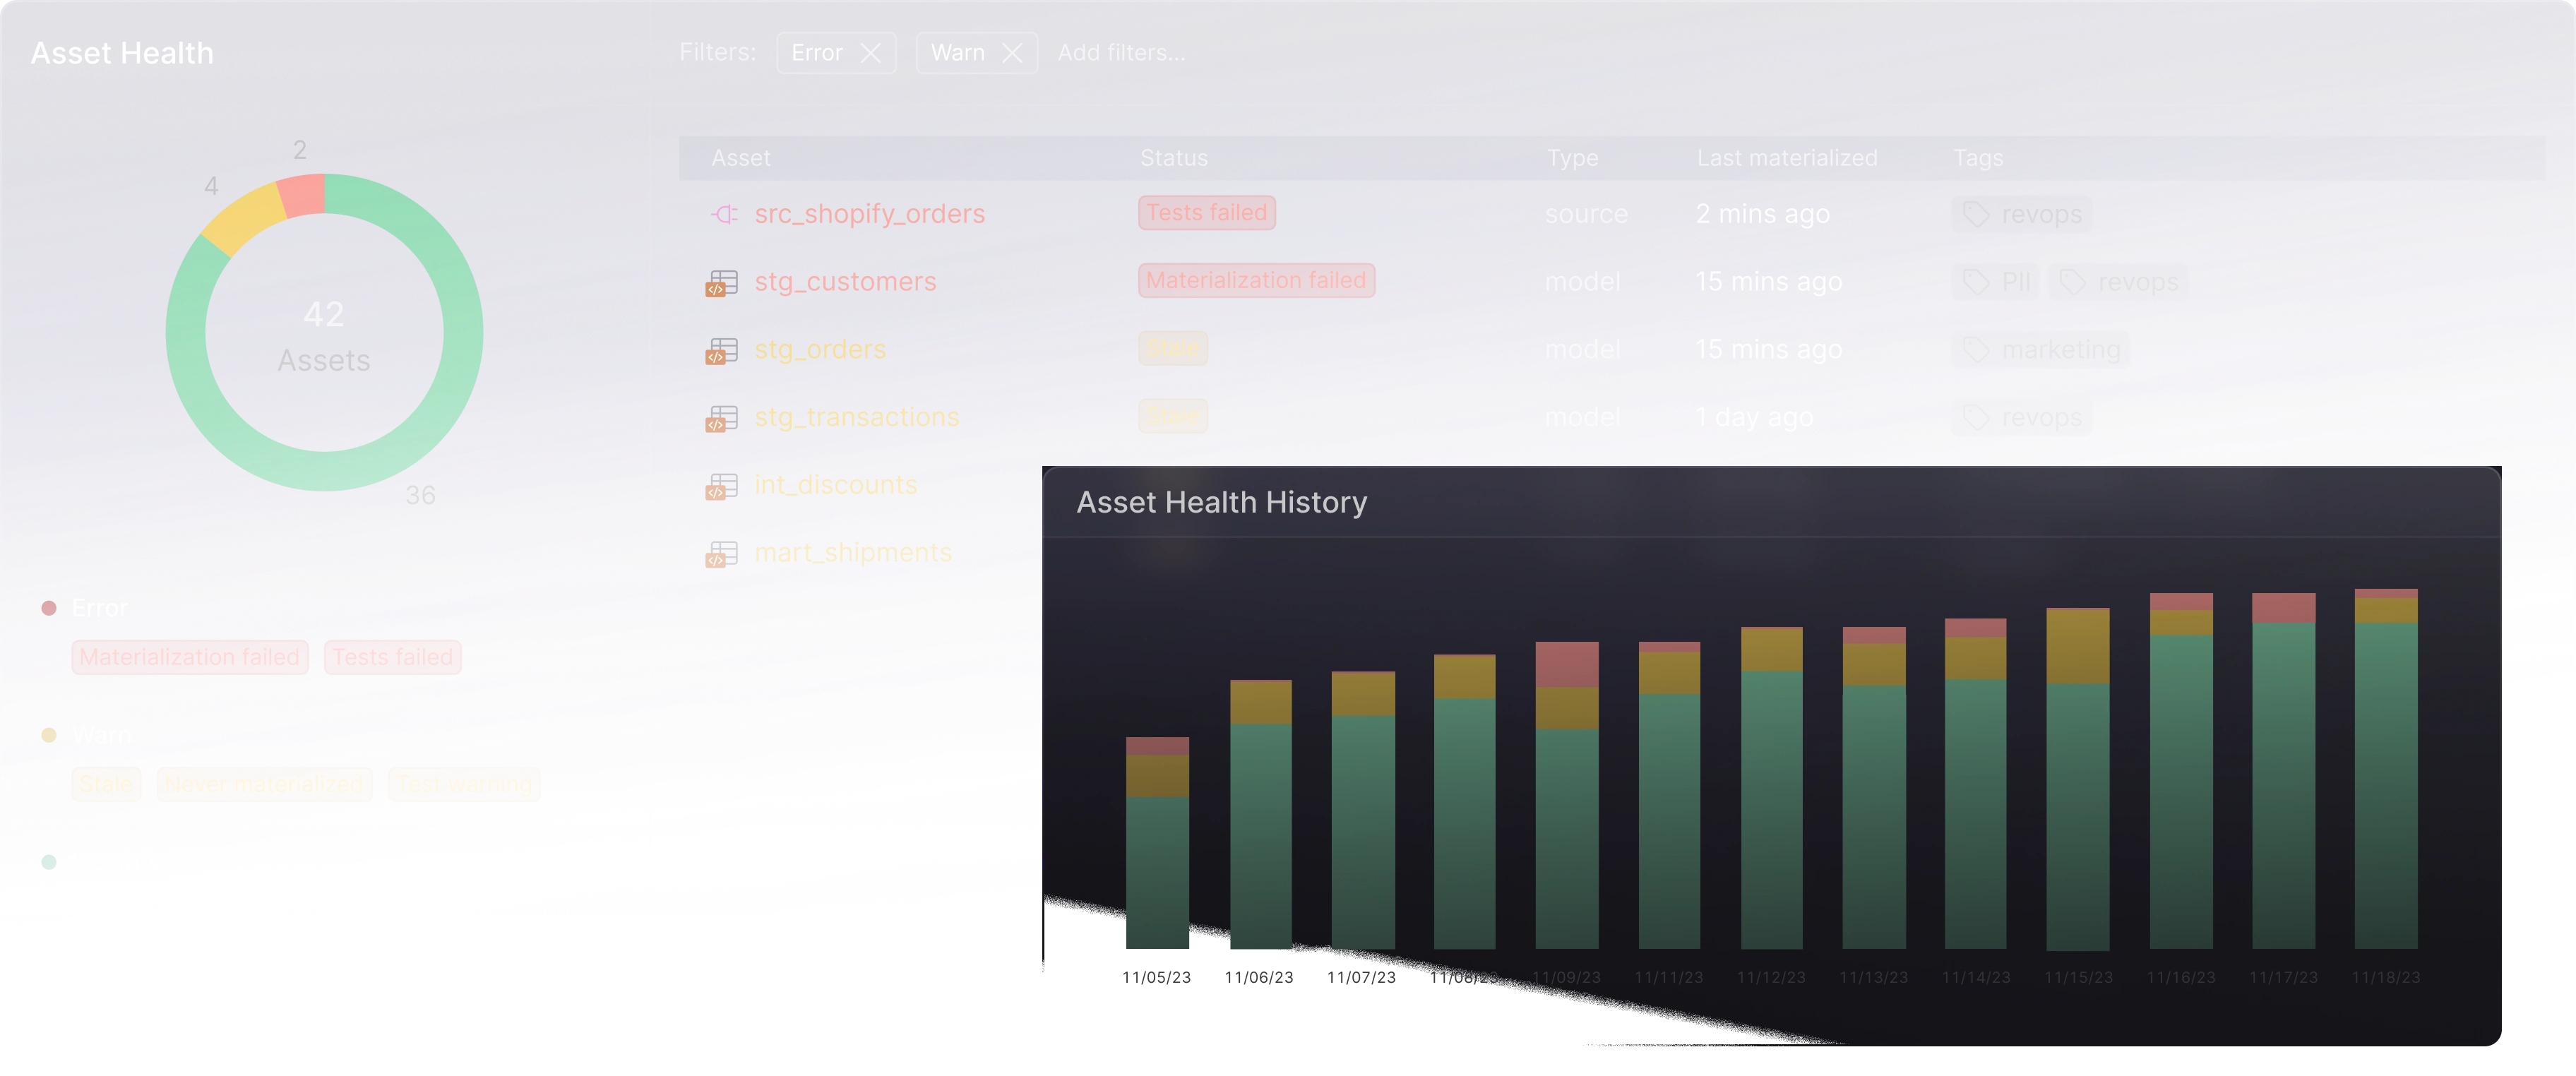
Debugging
Looking for a needle in your data haystack?
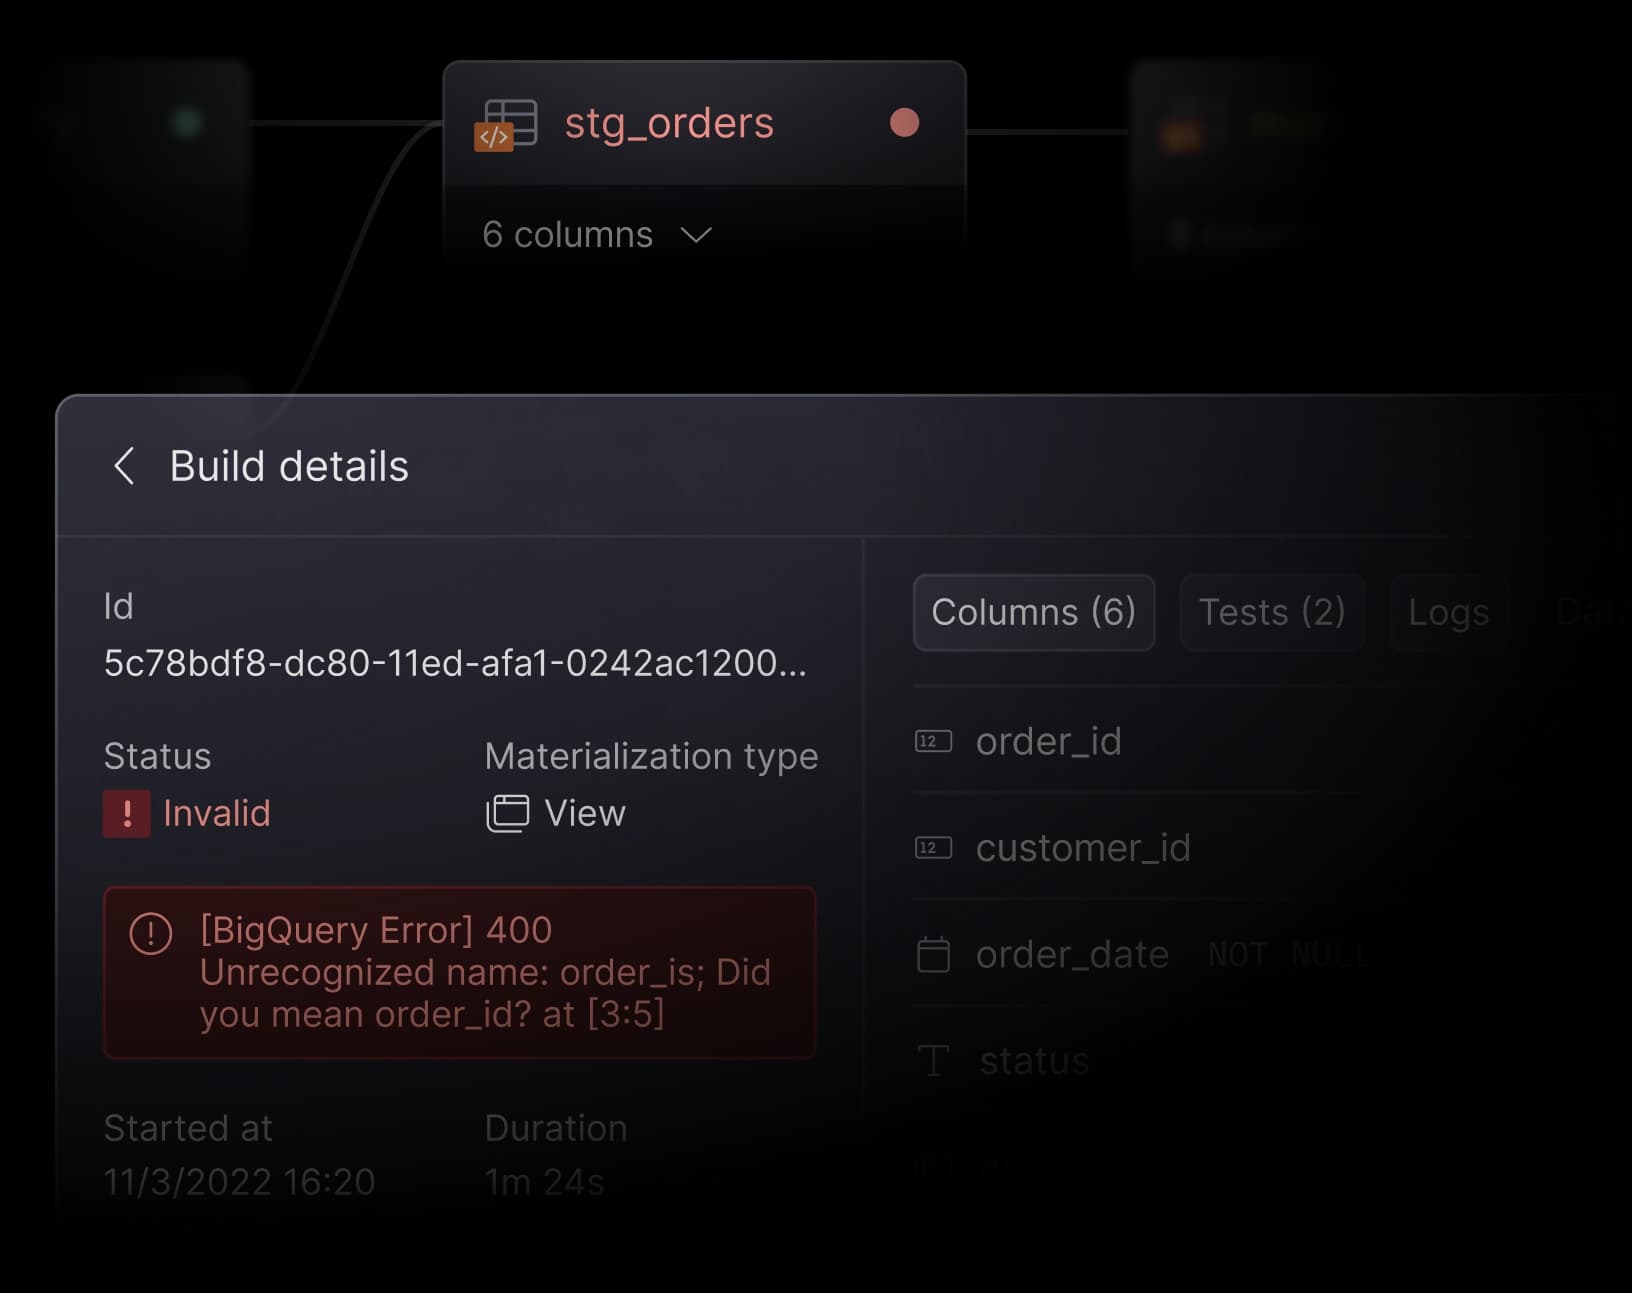
With asset-level build logs, you can quickly identify the specific step that caused a build to fail and view its error messages — so you can isolate the root cause of failure before it compromises your data.
Asset-level build logs
If a data pipeline fails, Y42 shows you exactly where and why — so you don’t have to parse lengthy job logs across multiple systems.
Explore documentation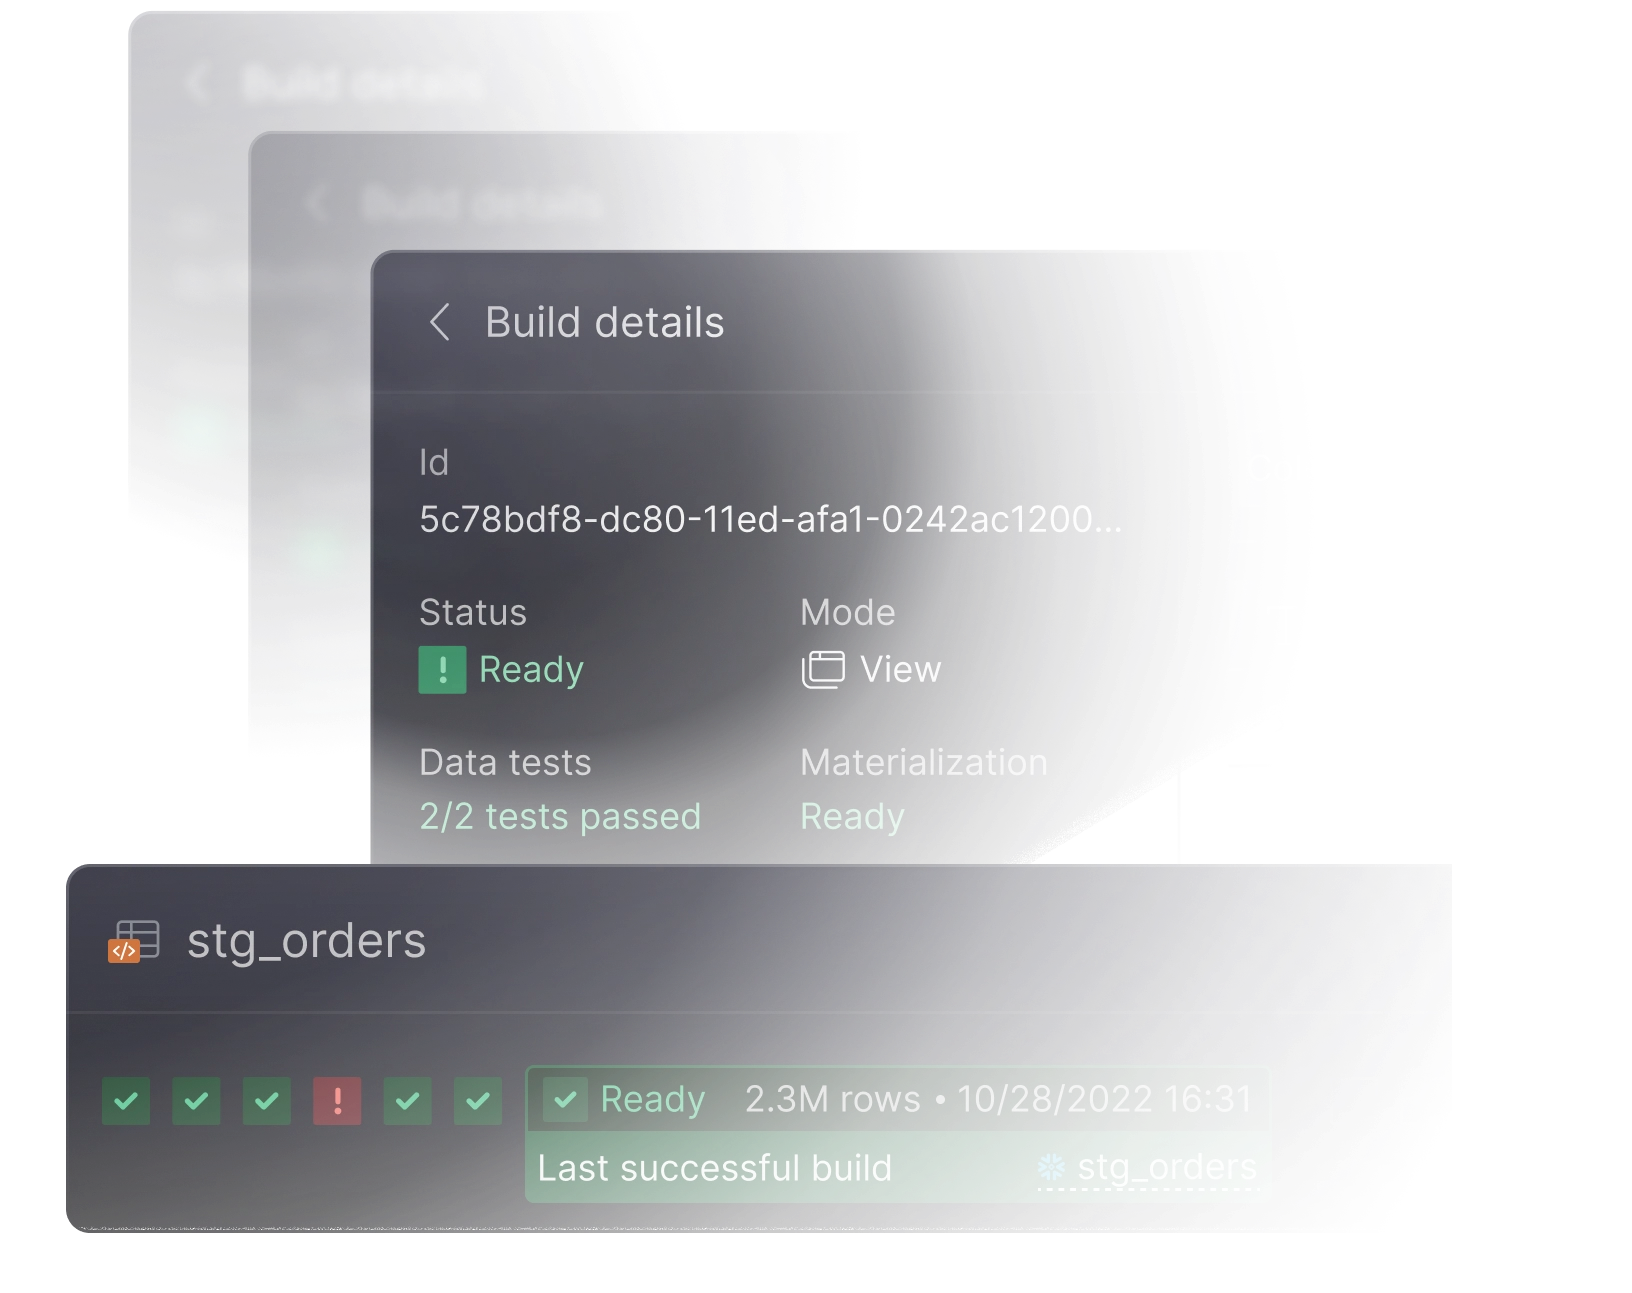
Time travel
Navigate through the historical changes of each step in your data pipelines and retrieve its build details at any given point in time.
Explore documentationData testing
Make data quality control a team sport
Our built-in data quality tests lets you validate columns and tables with a just few clicks. Set non-null assertions, uniqueness rules and more, directly in your workflow.
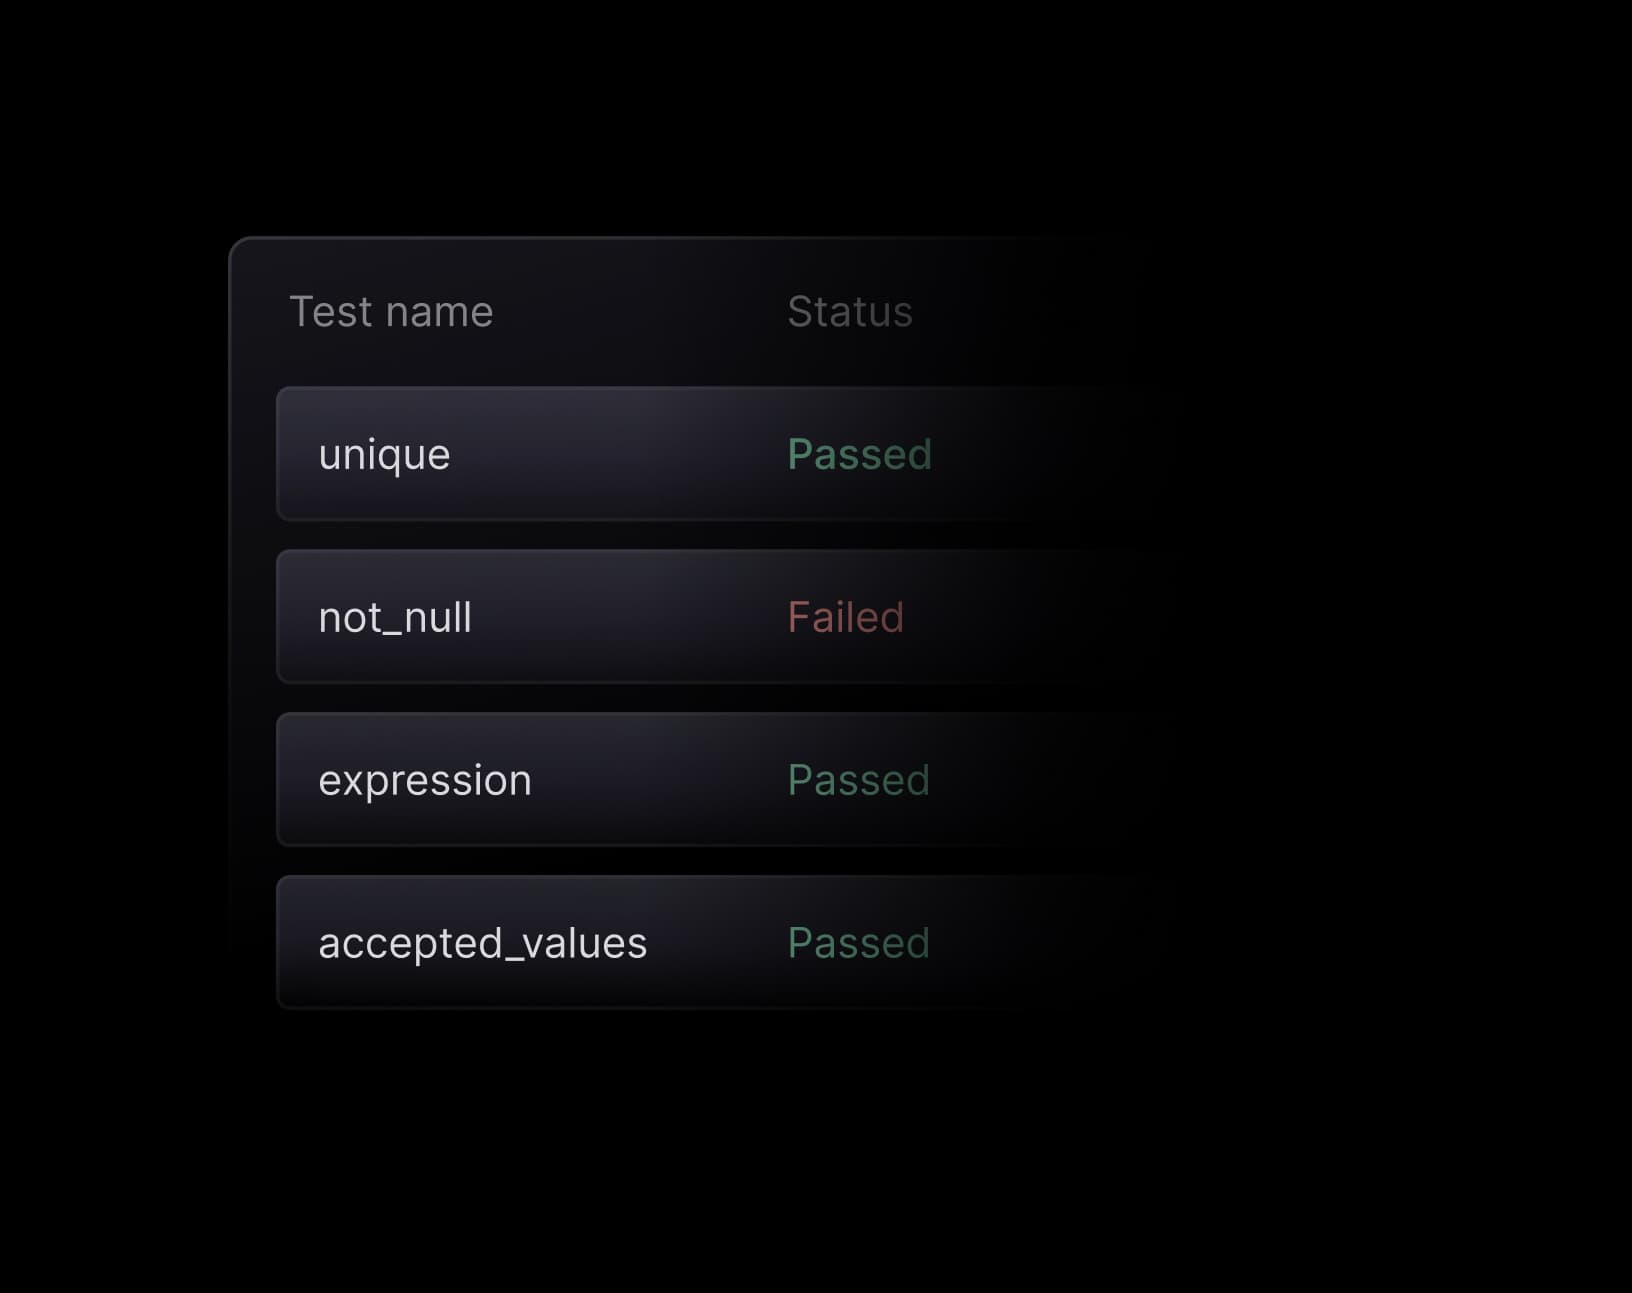
Table and column tests
Set preconfigured data tests using an intuitive graphical interface or flex your SQL skills by writing custom testing logic.
Explore documentation
Alerts
Set up email or in-app notifications for failed data tests, so you can address potential issues before they affect your production data.
Explore documentation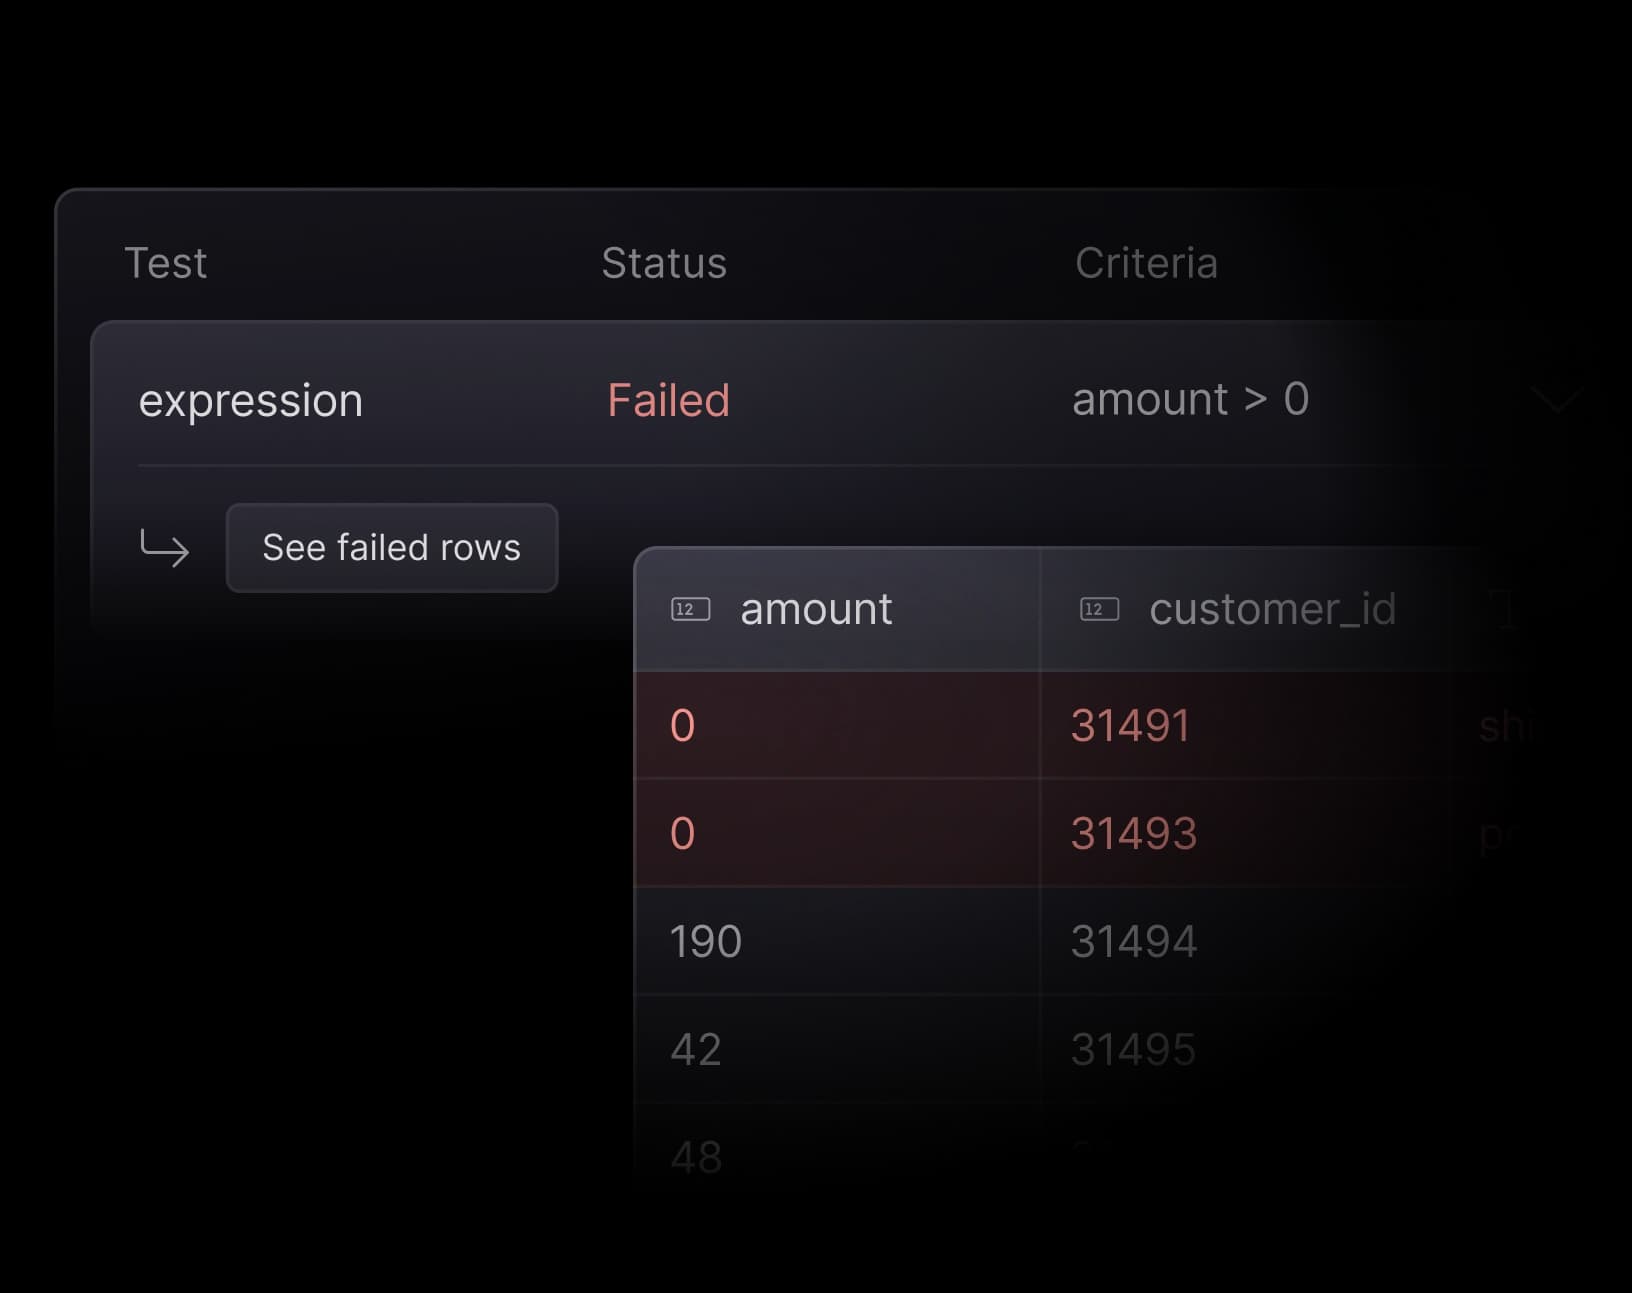
Inspect failed rows
Isolate and analyze rows that didn’t meet your testing criteria — so you can tell apart genuine data quality issues from valid edge cases.
Explore documentation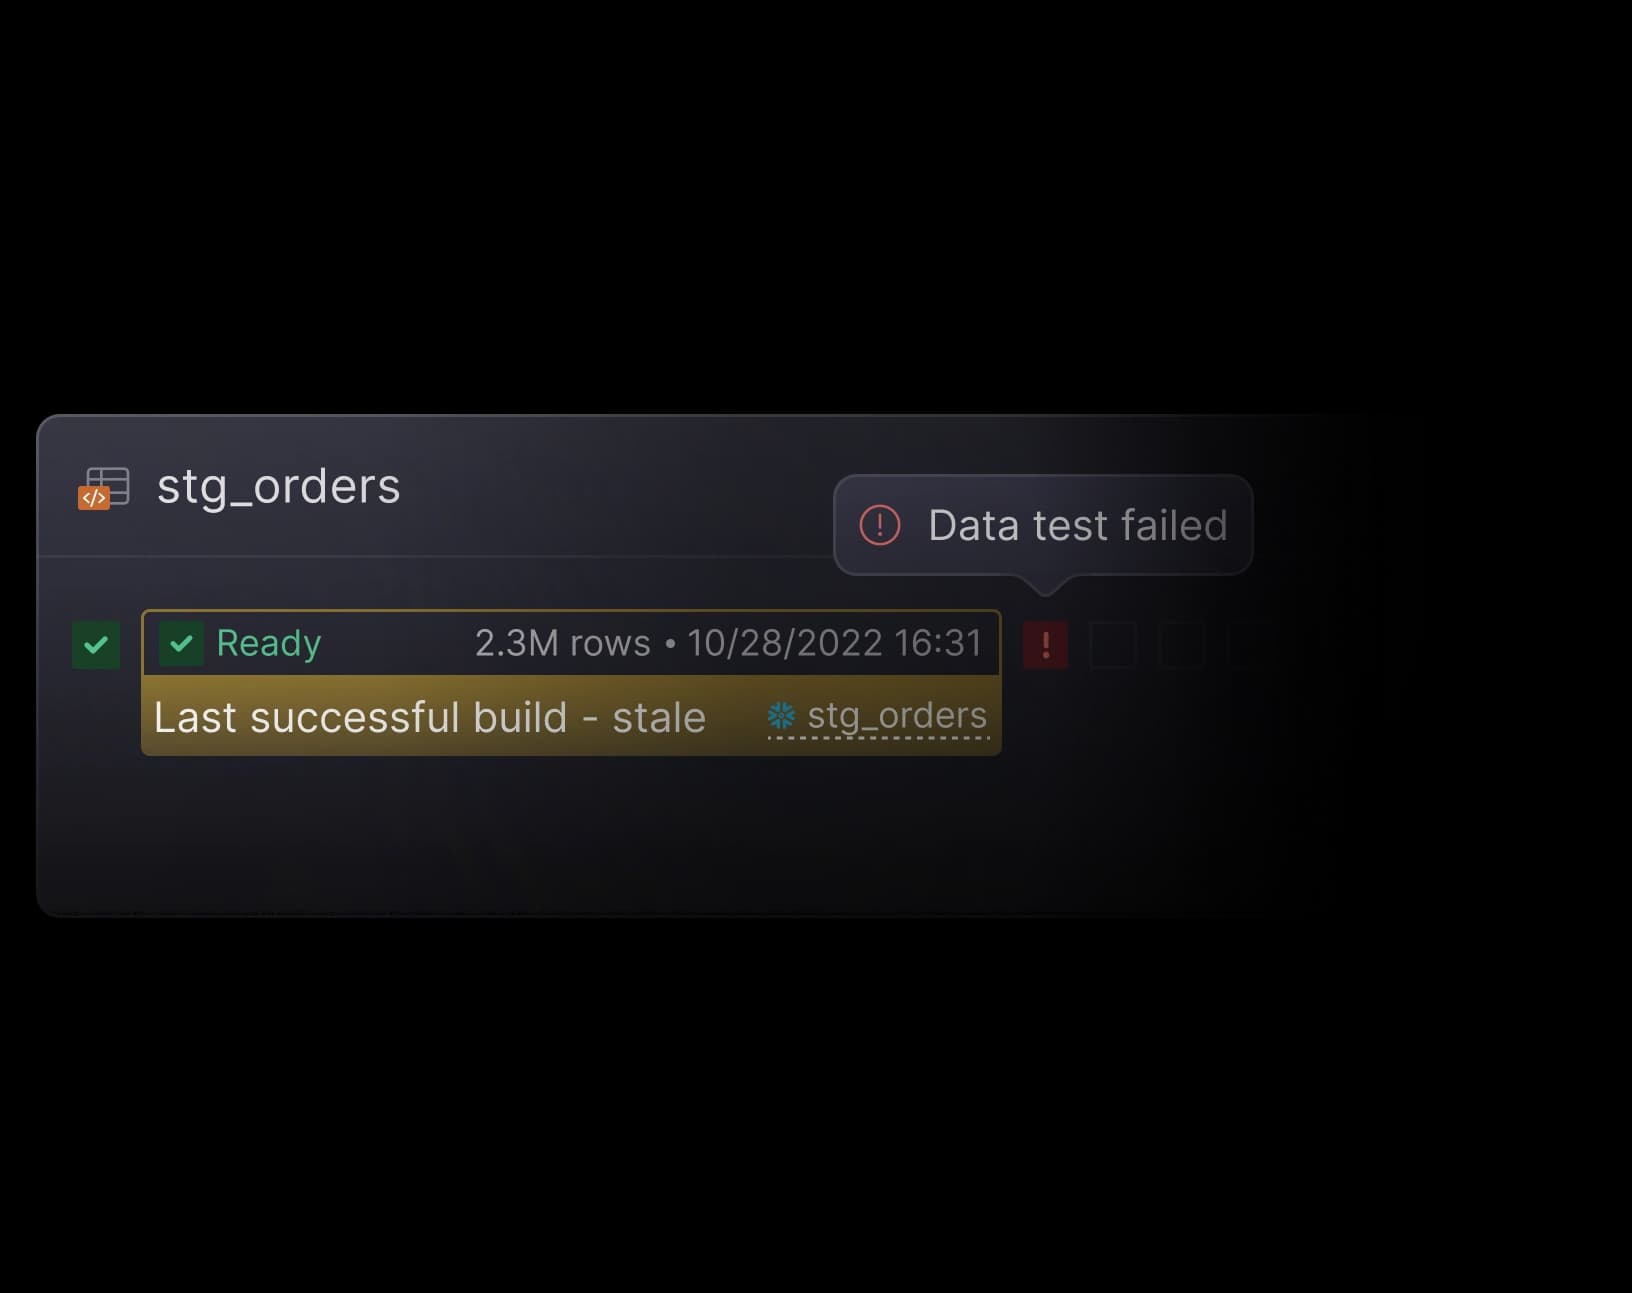
Graceful test failure handling
When a data test fails, Y42 references the asset’s last successful build so your production data pipelines always remain intact.
Explore documentation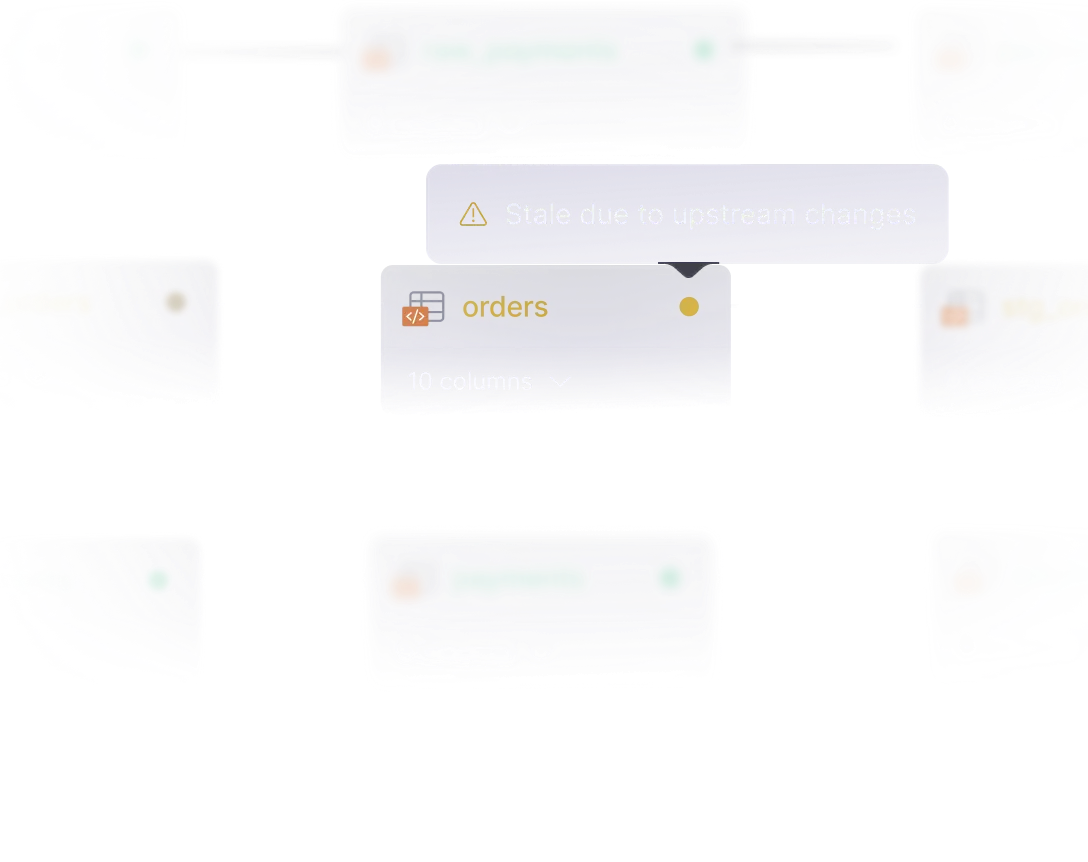
Stale dependencies detection
Automatically flag stale data when upstream steps change
When data or code changes, we'll show you everything that it impacts — so you can spot asset dependencies the moment they become stale.
Explore documentationReady to unlock your data universe?
The only Turnkey Data Orchestration Platform. Get started — for free.