Lineage
Lineage mode is one of Y42's platform interface modes. It shows relationships between all assets as well as their properties, making it easy to understand the flow of data in complex data pipeline architectures.
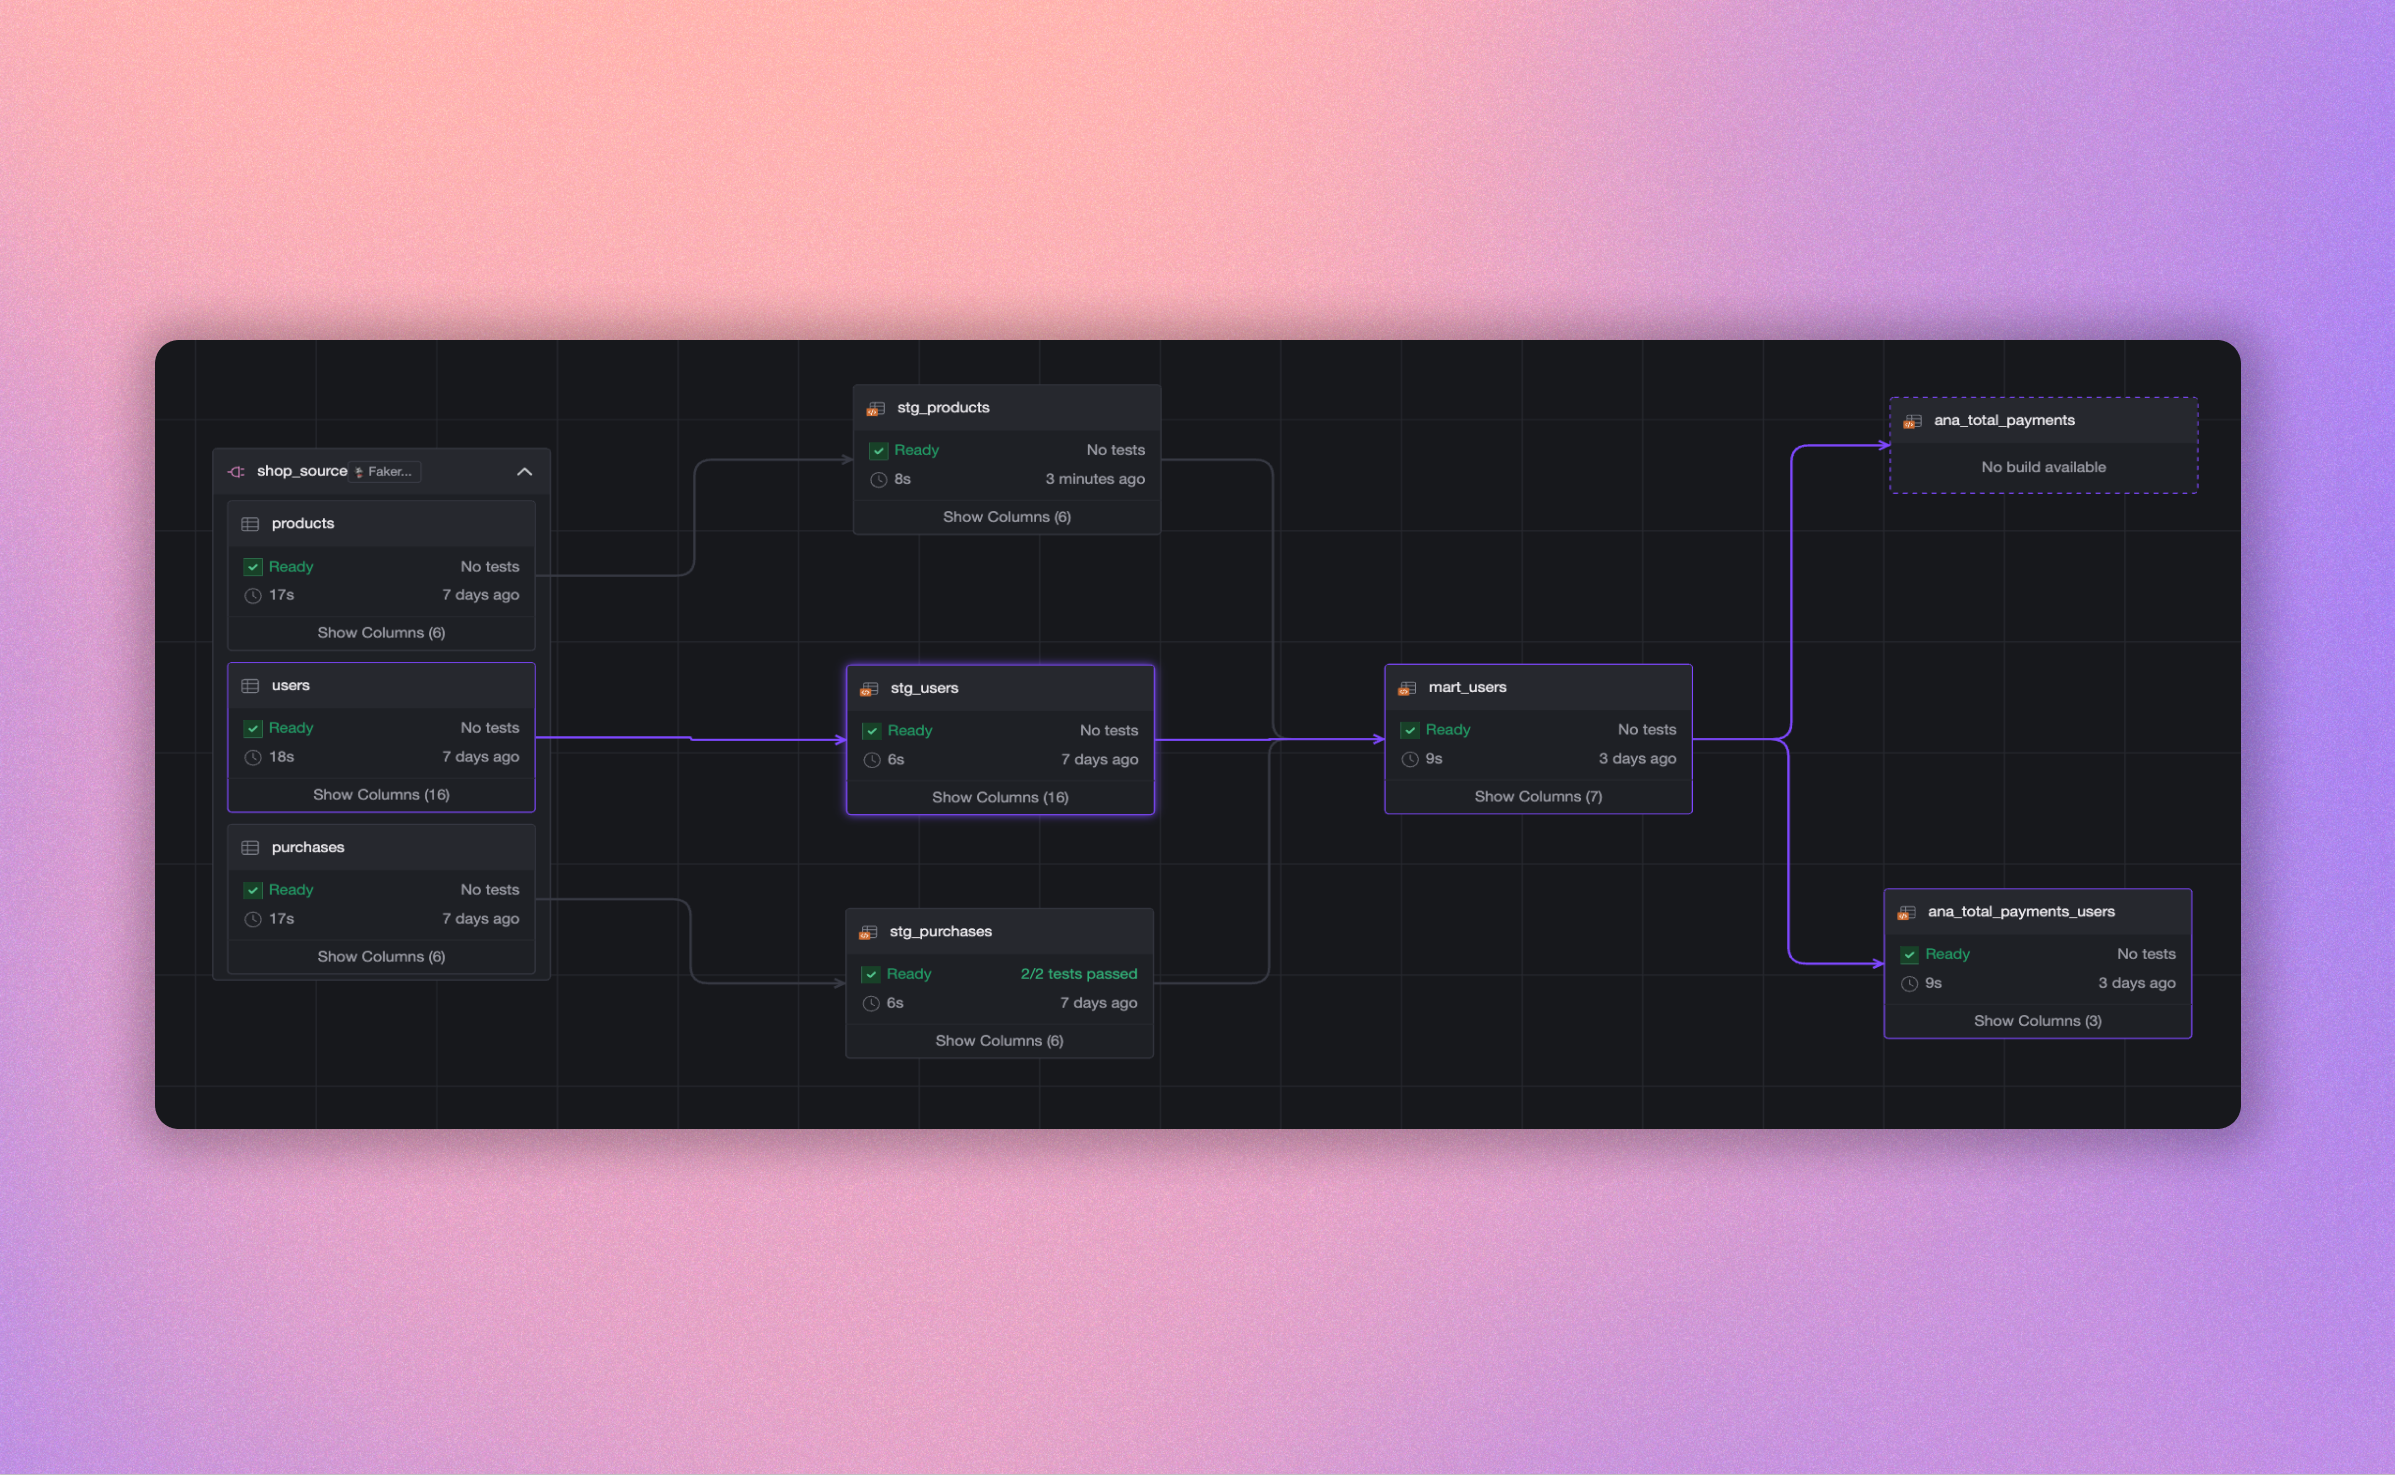
Visualization of data movement in Lineage mode.
The lineage view aids in understanding complex data pipeline architectures at both table and column levels. Table-level lineage shows connections between tables, while column-level lineage provides a more granular perspective on data flow by revealing how specific columns are interconnected within the pipeline.
Navigate through Lineage
In your SQL statements, you use {{ref}} to reference your model assets and {{source}} to reference your source assets.
These references form the lineage, which provides an overview of all assets and their relationships.
To better navigate through the lineage, use the following three actions:
| Icon | Action |
|---|---|
| Search: Find an asset by searching for its name, type etc. | |
| Filter: Set filters to sort assets by their type, tags, status, and connection type. | |
| Data flow: Visualize the dependencies between the assets and see the flow of the data. |
Modify assets with the integrated Data catalog
You can open the asset list in lineage mode to modify assets without switching to the full data catalog mode. This way, you have a better overview of your asset's origin when defining your assets.
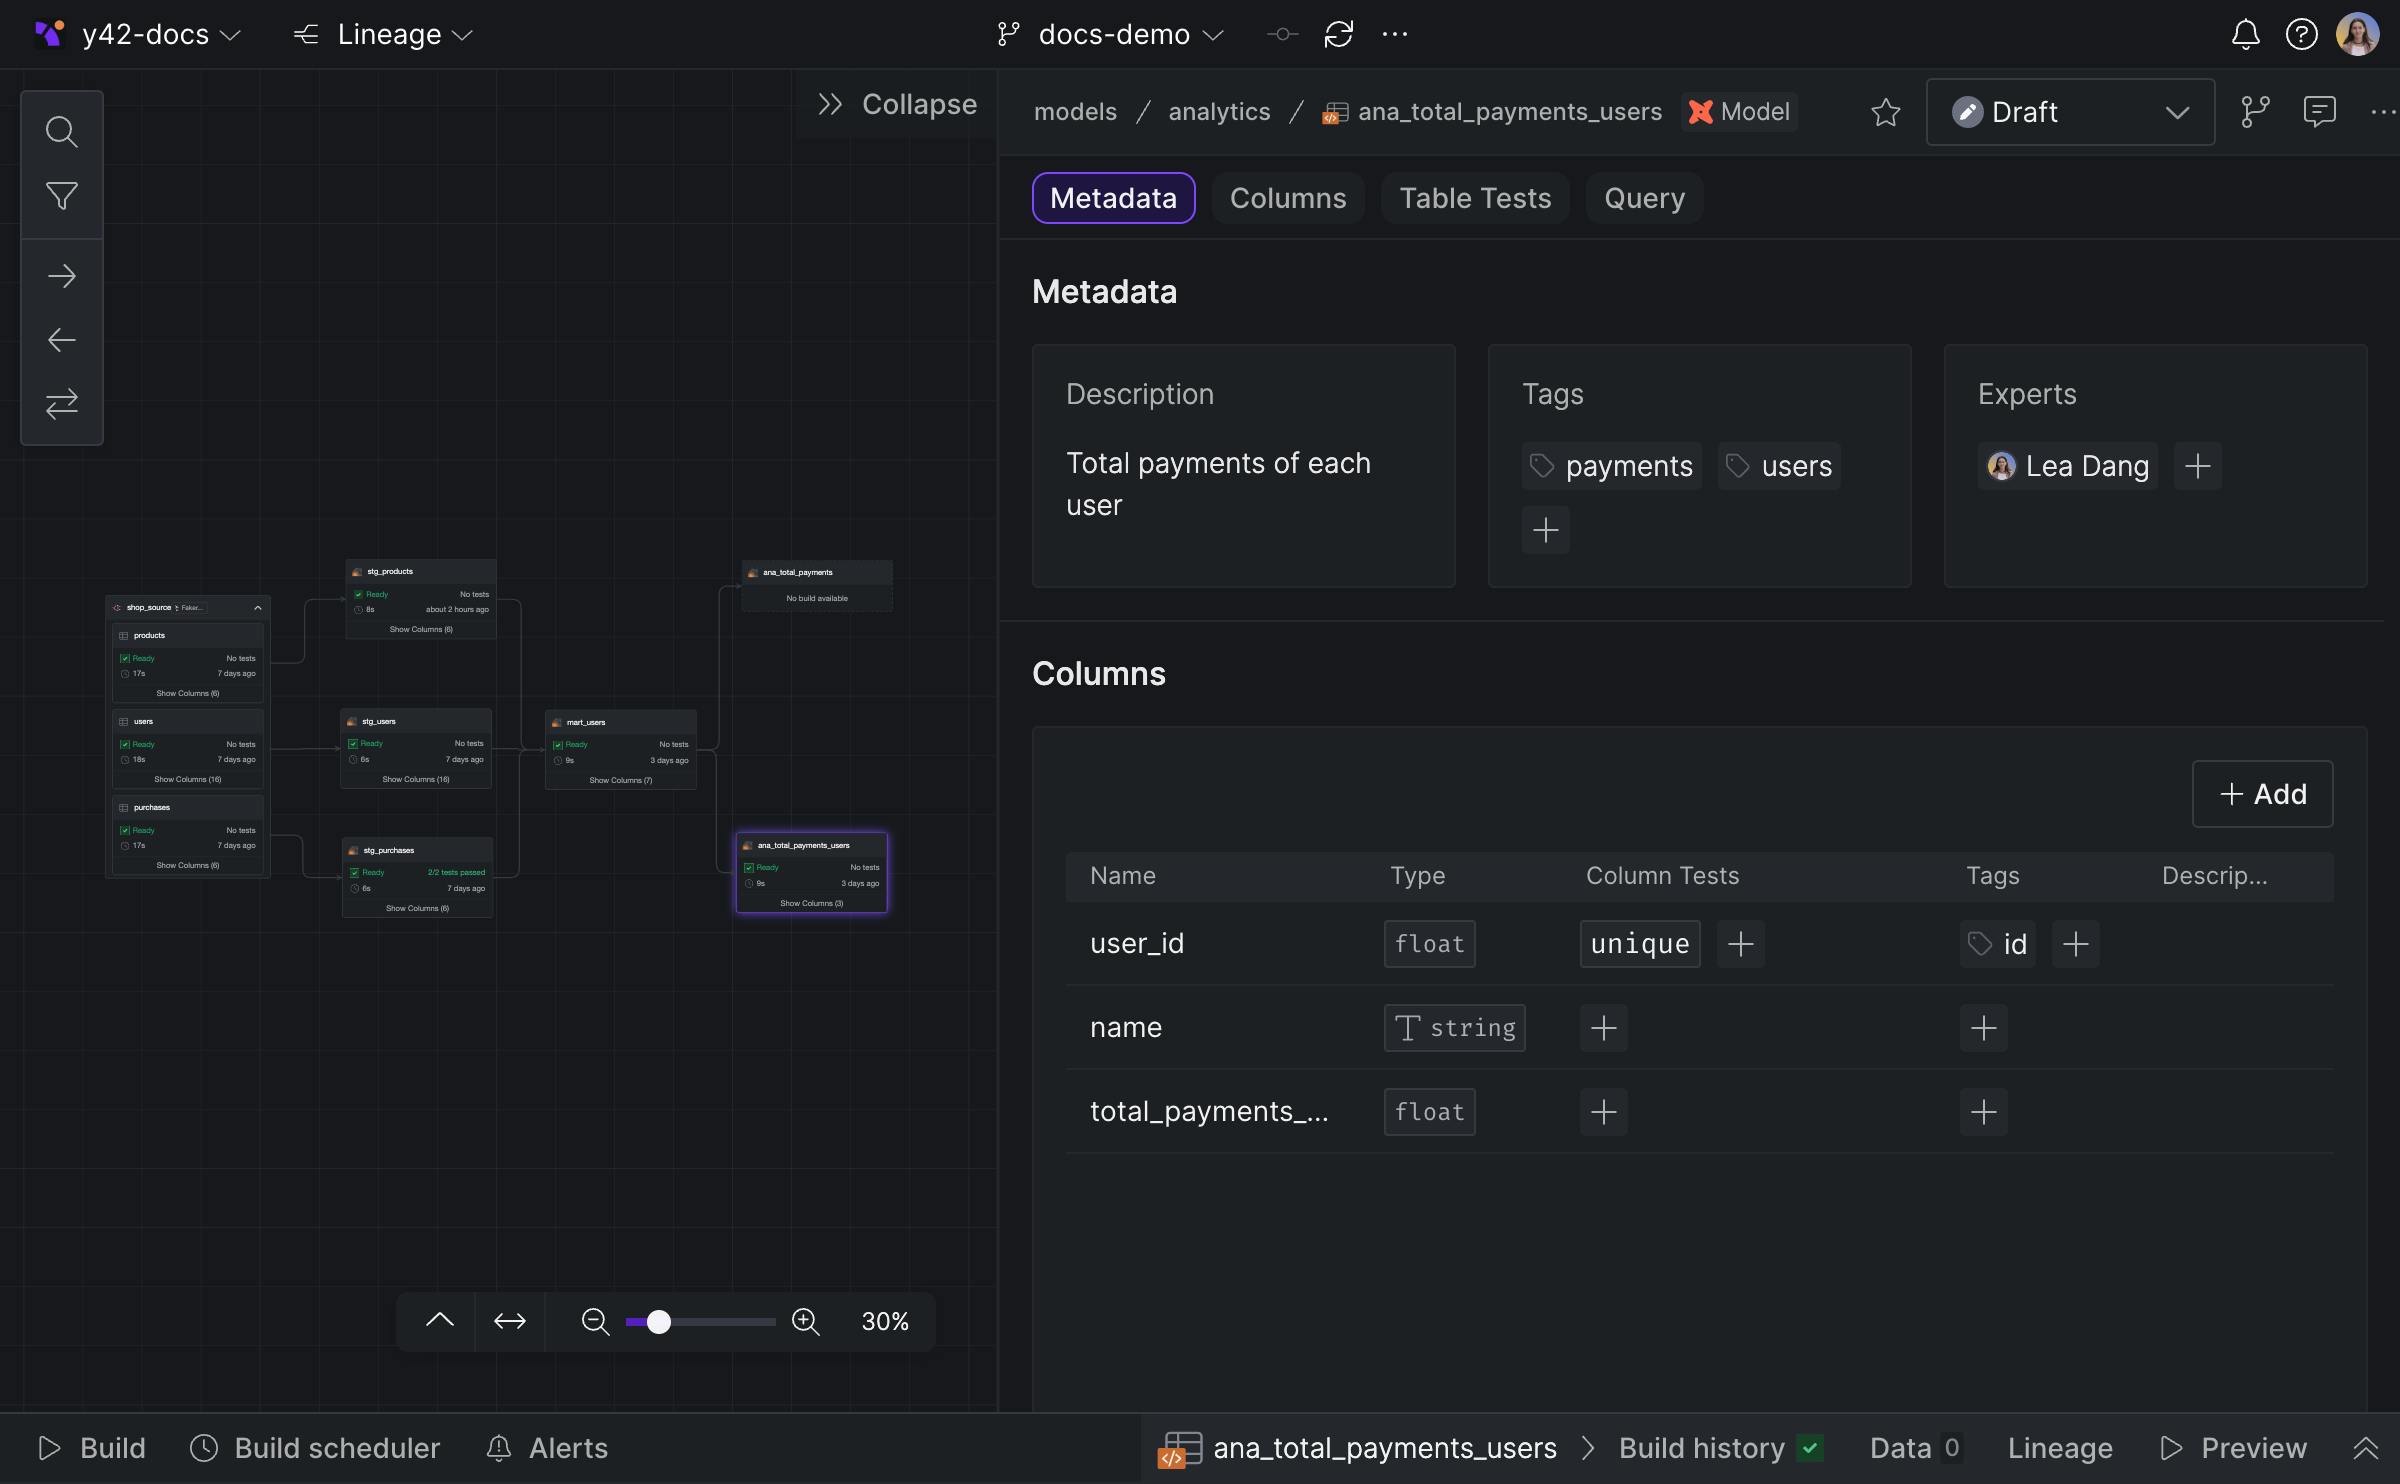
Visualization of data movements starting from a source asset.
Use Lineage mode
Column-level lineage
Column-level lineage provides a detailed view of how individual columns in a dataset are sourced, transformed, and consumed within your data pipeline. Unlike table-level lineage, which offers a high-level overview of data flow between tables, column-level lineage dives into the intricacies of data transformations and dependencies at the column level.
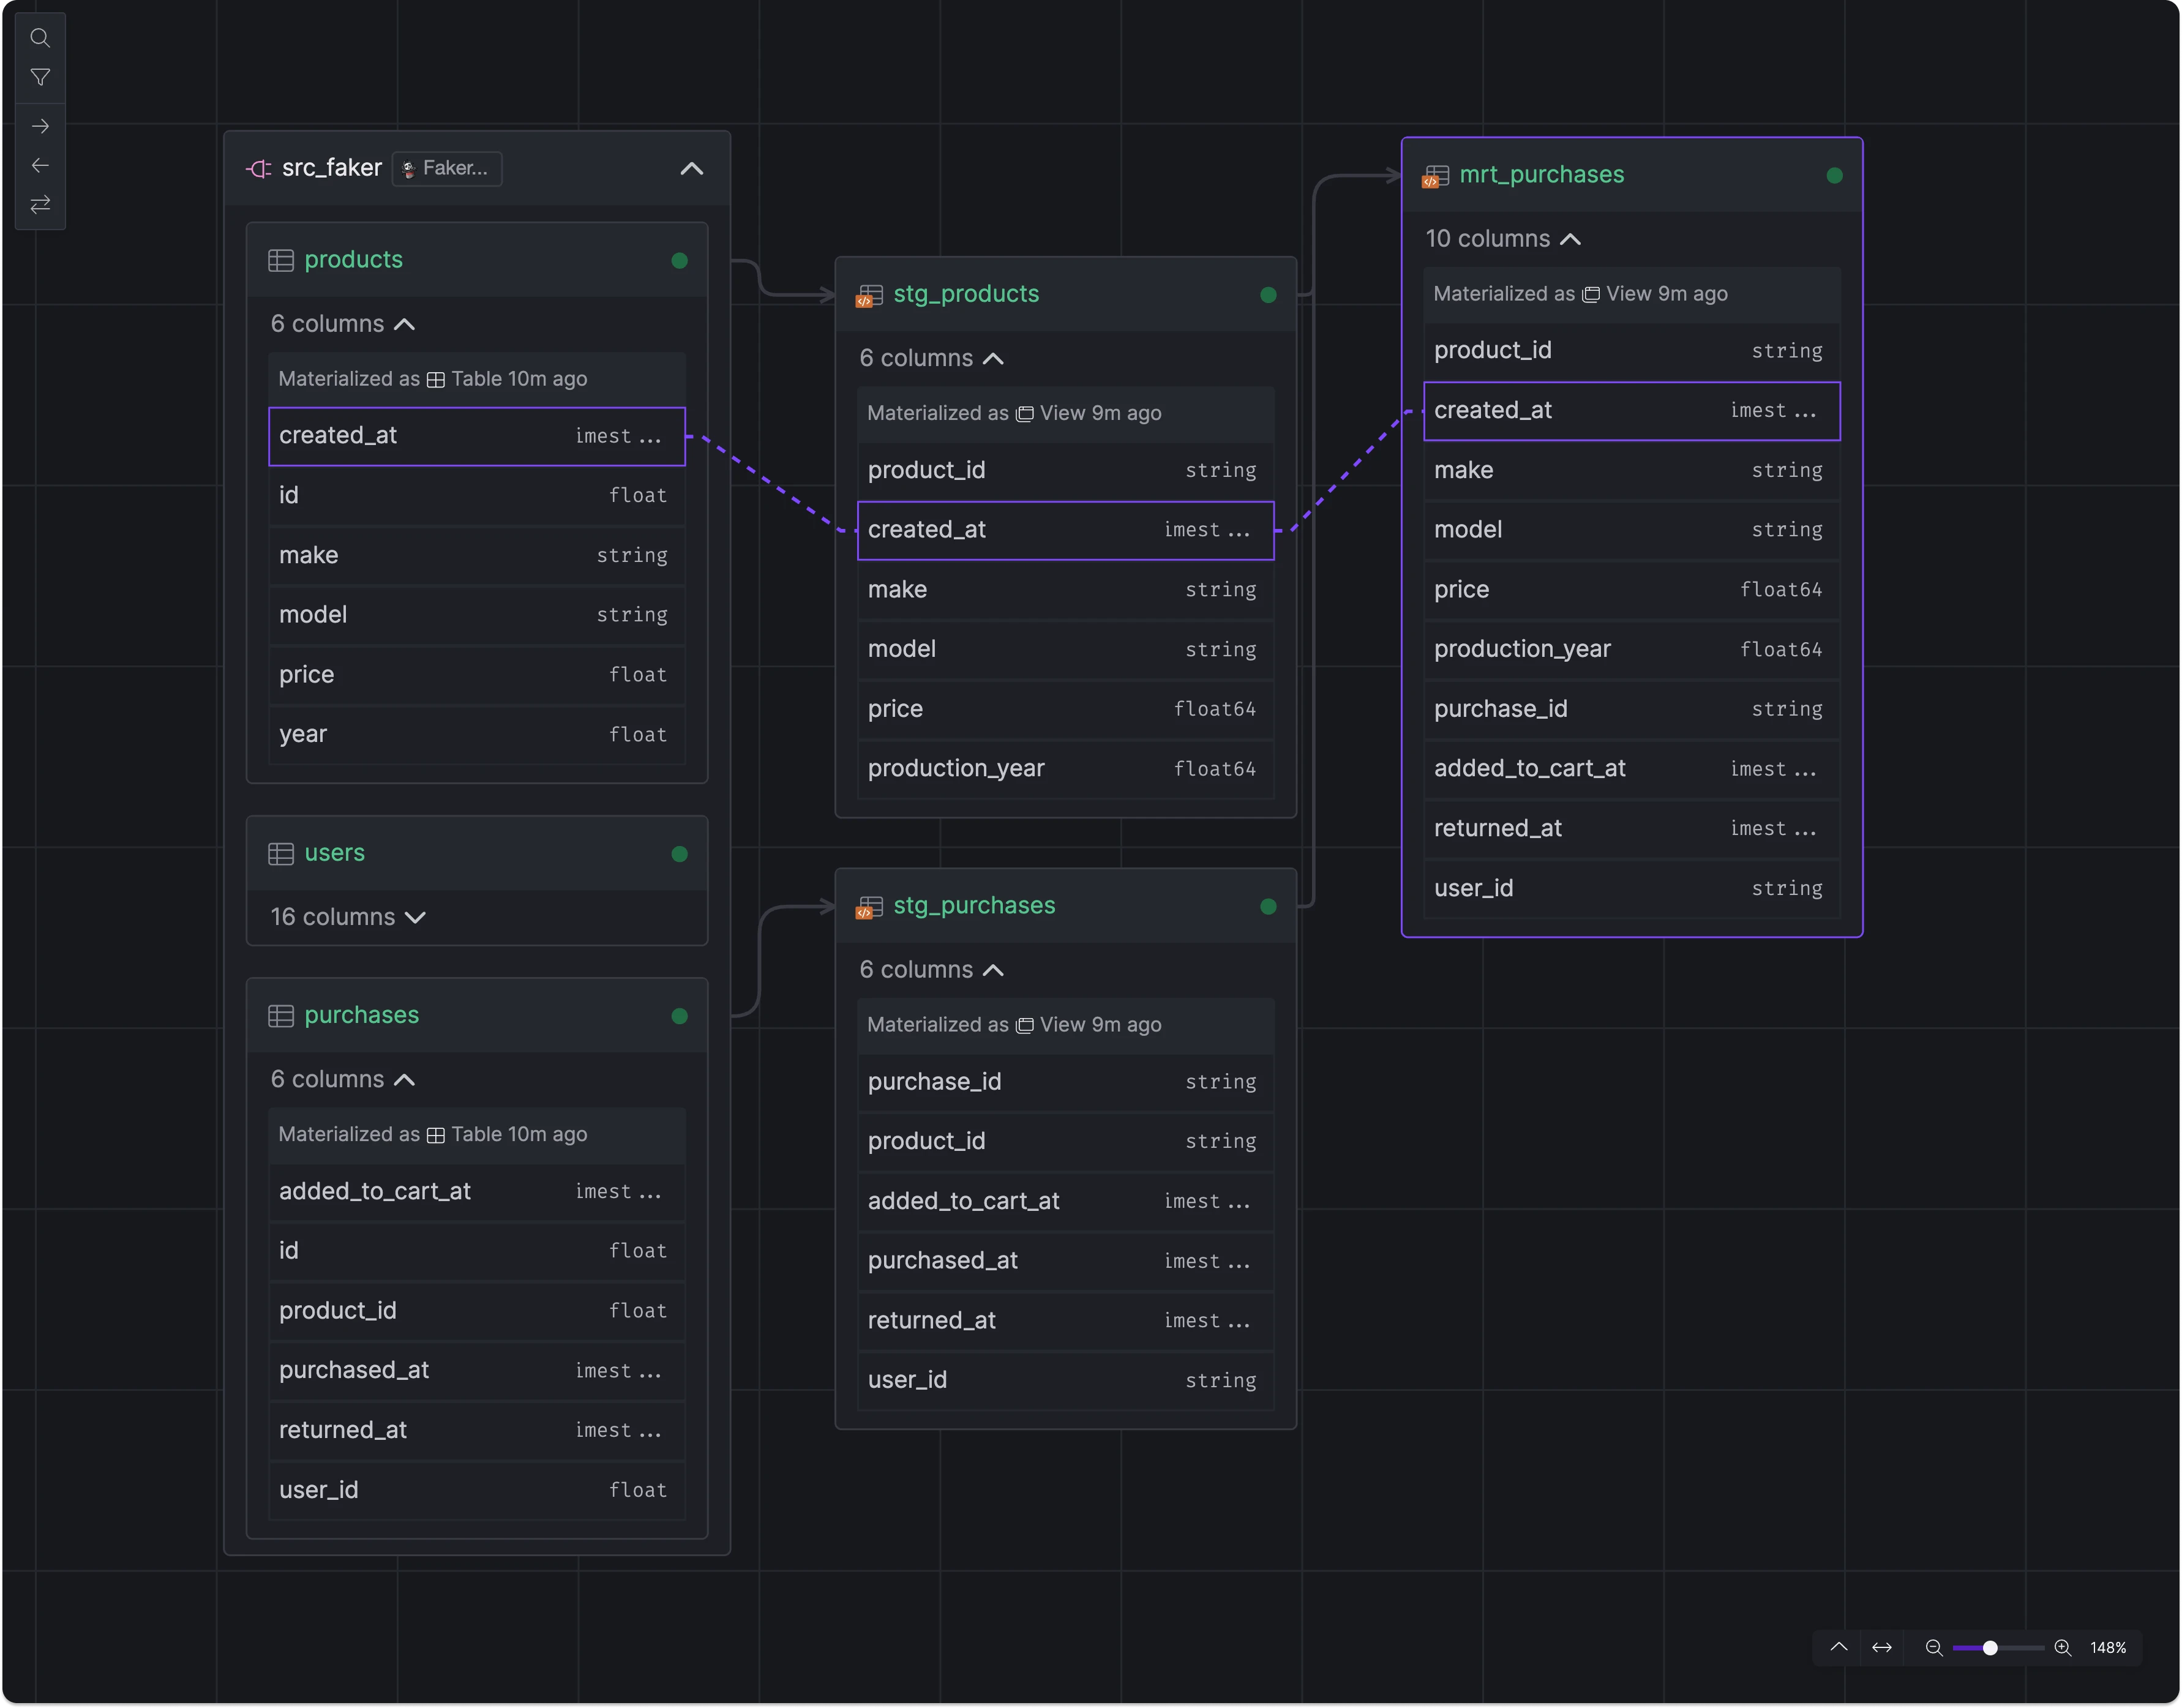
Visualization of data movements at the column-level.
When you hover over any of the links at the column level, it reveals the specific usage of the column downstream, indicating whether it participates in operations like JOIN, WHERE, GROUP, or a combination these.
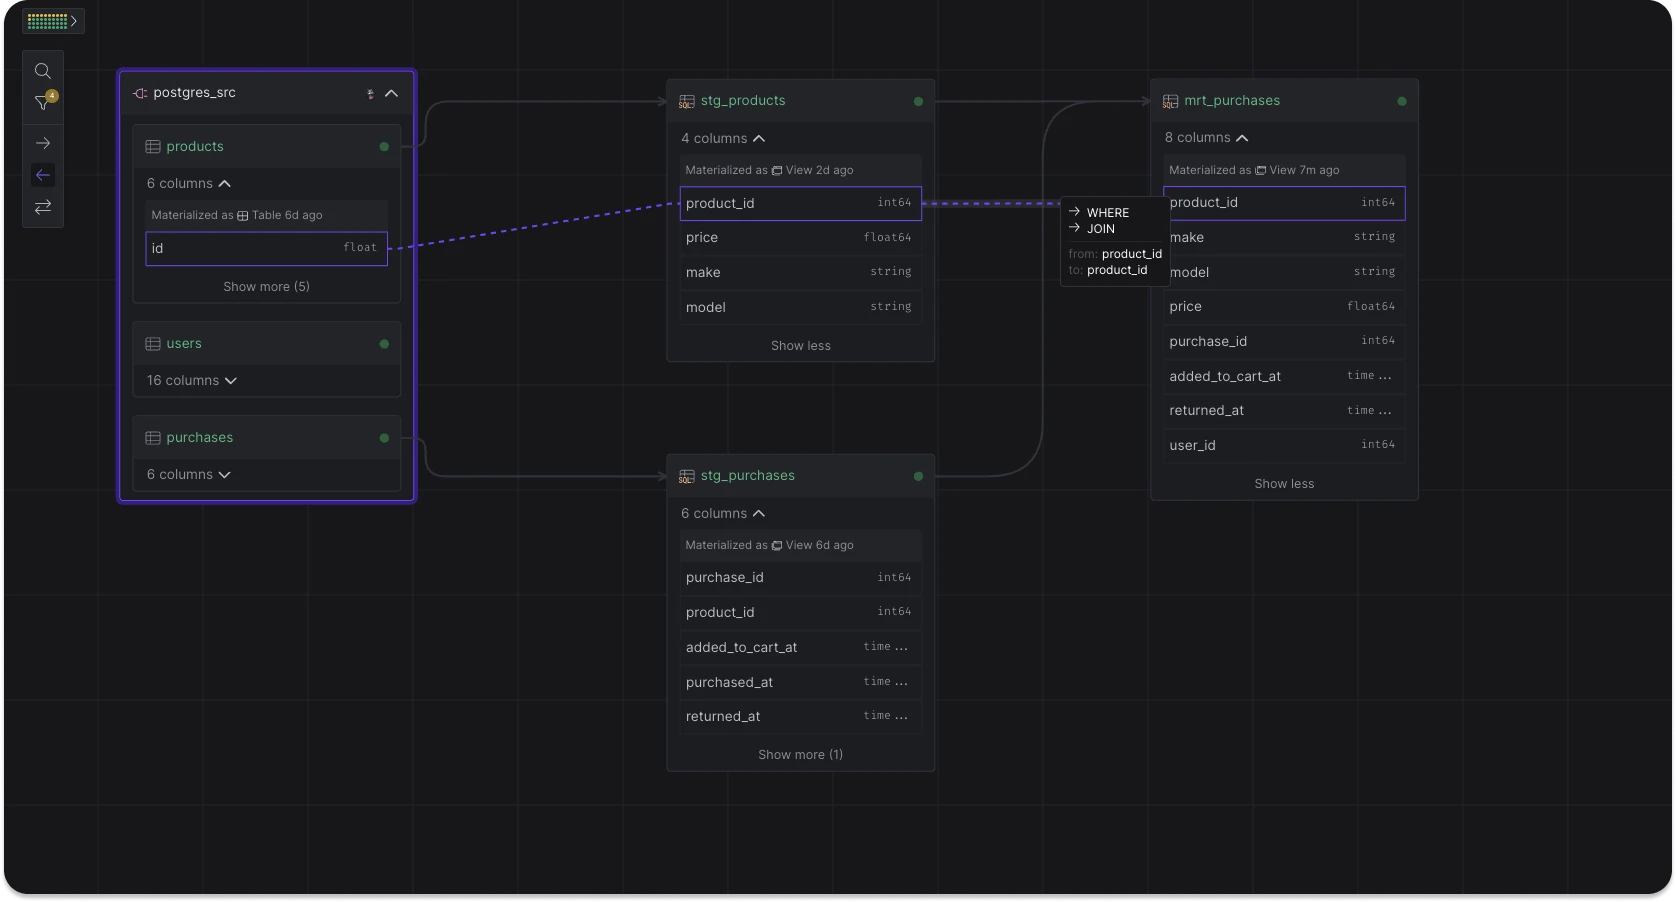
Visualize how each column is referenced downstream.